Powerful and purposeful storytelling for business << Back
Posted on:
By Sam Knowles, Founder of Insight Agents, and Brighton Summit workshop leader.
How we use numbers to tell stories – to convey meaning and to persuade others to hear and understand our point of view – has come into sharp focus in the age of Big Data.
The sheer volume of information that surrounds all kinds of organisations – from businesses to charities, from NGOs to regulators – presents communicators with a delicious paradox. It has never been more challenging but at the same time it has never been more possible to use data as the foundation of powerful and purposeful communication. The trouble is, where to start? How much to share? And how to talk in that rarest and most impactful of corporate dialects: human.
In preparing my workshop for this year’s Brighton Summit on powerful and purposeful storytelling for business, I asked the team at the Brighton Chamber to give me as many interesting facts and figures about previous Brighton Summits as they could find. Big up to Bee Nicholls in particular for providing me with 29 killer statistics from the past five years.
Read as a list, over and over, Bee’s data starts to give a flavour of the very special, very unusual event that the Brighton Summit truly is. Unfiltered, unedited, and in the random order in which she passed them over to me, here’s the raw data.
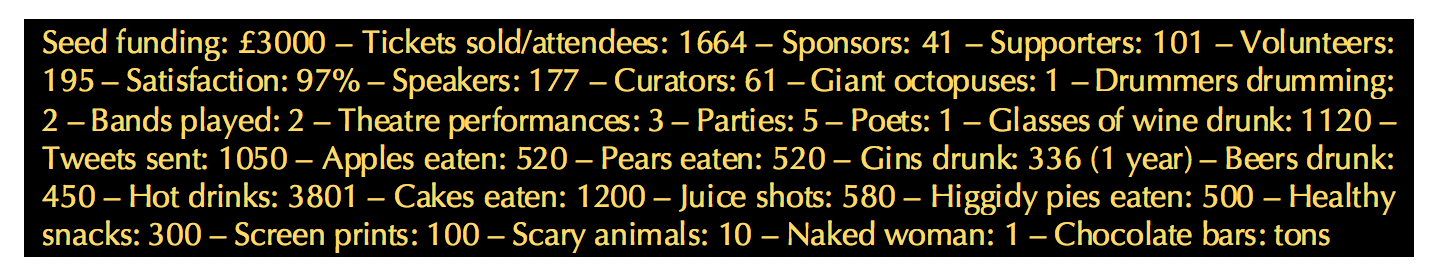
Presented like this – in the form, format, and font used by the great font designer Hermann Zapf for his Washington D.C. Vietnam veterans war memorial – it immediately tells all sorts of stories. Of the surprising scale and unexpected reach of this dynamic event. Of delegates well fed and drunk, sustained by local produce. Of entertainment as well as learning, of engagement, of wellbeing and the smorgasbord of different types of event offered throughout the day.
The more often you read the list, the more satisfying the feast becomes, the more you realise the Brighton Summit has to offer and manages to pack in to a single day. It’s like an impressionist or pointillist painting, first seen up close as individual elements, and then slowly making sense as a whole as you see it from a greater distance. Dwell awhile, and the more you realise the Brighton Summit justifies its billing as “the best day you’ll spend out of the office all year”.
The problem is, presenting everything – raw and unfiltered – can be overwhelming, exhausting, and time-consuming to decode and process. It’s too much, and an uninformed, time-poor reader can soon turn away in confusion, frustrated at not being led or directed. The data presented are neither simple nor, necessarily, relevant. There’s too much backstory – what script- and novel writers call “exposition” – and there’s neither enough clarity nor focus.
So what happens if you strip out the things that the numbers qualify (the pies, the naked women, the delegate satisfaction) and you create a word cloud of just the numbers? Is that helpful?
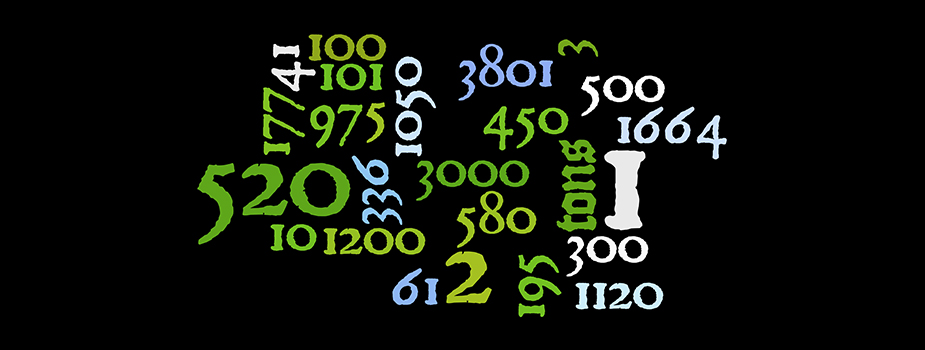
It’s intriguing, no doubt, and some might say pretty. It doesn’t overdo the backstory, that’s for sure. But it doesn’t do much on the storytelling front, either. There’s no context, no meaning, just a series of numbers and little more. A bit like many of the dashboards and summary reports many present to bosses and colleagues and clients, claiming them to be full of meaning and insight, but actually signifying nothing. What’s more, as a mentor of mine once told me, responding to a word cloud I’d presented to him: “The word cloud truly is the mullet of analytics. People thought it was cool and sexy in the 1980s, but time moves on. Kill the word cloud.”
Using data and statistics to tell stories brings together the two skills that everyone in the knowledge economy needs if they’re going to survive and thrive in the 2020s and beyond.
- The ability to look at and make sense of data
- The ability to use the genuine insights extracted from the data to persuade others to take notice and take action
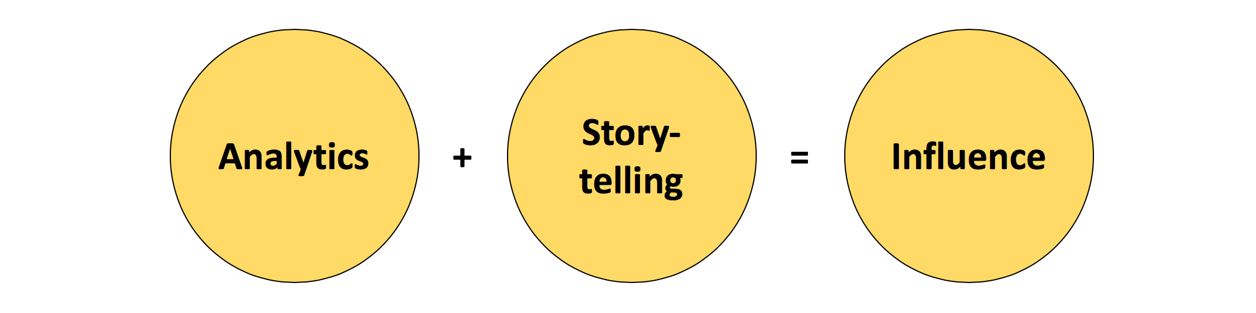
For me, the fundamental equation of modern business impact can be expressed in this simple equation:
So what, from my prism of effective data-driven storytelling, would I recommend for telling the story of the Brighton Summit through numbers? How do we keep it simple? Use relevant data – and not false positives? Avoid the insider’s Curse of Knowledge?
To create an effective narrative using numbers is not all about being a statistical whizz-kid, and it definitely doesn’t require that you show all your workings out. It’s about being truly empathetic, being able to put yourself in the shoes – in the mind – of those you’re trying to influence. And talking human.
So for me, the numerical starting point for talking about why anyone should attend the Brighton Summit is 97. 97%. An arresting opening sentence could be just those three characters.
“97%. Would you really want to miss out on an event that boasts a satisfaction rating of 97% from almost 1,700 delegates over the past five years?”
To find out more on how you can tell more impactful stories for your organisation using data and statistics, make sure you book yourself in for my workshop at the 2018 Brighton Summit, “Powerful and purposeful storytelling for business” from 10.15-11.30am on Friday 12 October. More details here.
Sam Knowles is the Founder & MD of storytelling consultancy Insight Agents, and is in demand as a wordsmith, trainer, blogger, and podcaster. His purpose is to help companies sound and talk like people. In April 2018, Routledge published his book Narrative by Numbers: How to Tell Powerful & Purposeful Stories with Data. Find out more at www.narrativebynumbers.com